TranscriptAgent
Try it free
TRANSCRIPTAGENT.AI · transcript analysis

Bitcoin (BTC): This Is Where the REAL Bottom Happens… Most Will Miss It (WATCH ASAP)

Channel: MegaWhale Crypto Published: 2026-01-02 20:00
MegaWhale Crypto

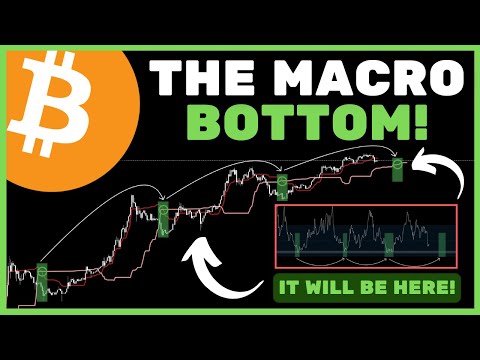
The speaker argues Bitcoin is in a larger post-top consolidation phase that may ultimately bottom much later, potentially around October 2026, with a price range of roughly $36k–$52k if the historical cycle pattern continues. Near term, he sees Bitcoin stuck in a choppy range after a triangle breakout, with upside only if BTC reclaims the range high and downside risk increasing if it loses key support around the low-to-mid $80k area.

Watch on YouTube ›

Get the market thesis, key claims, assets, contradictions, and follow-up questions from any financial video — then unlock a version personalized to your portfolio, watchlist, and favorite speakers.

Detailed summary

The video is a Bitcoin bottom call framed almost entirely through technical and cyclical analysis. The speaker’s core thesis is that BTC has already completed the first post-top mean-reversion leg and is now in the consolidation phase of a broader bear-market/cycle structure, with the true capitulation bottom still likely ahead. He repeatedly emphasizes that this is not a personal opinion but an interpretation of the chart pattern set: if the 4-year cycle and his 164-day bar framework remain valid, the implied bottom date is around October 5, 2026, roughly one year after the October 6, 2025 top he references. He builds the thesis from several layers of historical pattern work. …

🔒 The full detailed summary continues — read all of it free with an account. Read the full summary →

Main takeaways

  1. He expects Bitcoin’s true cycle bottom much later, around October 2026, if the historical 4-year pattern repeats.
  2. His estimated bottom price band is roughly $36k–$52k, derived from Gaussian channel, EMA, RSI, and Ichimoku signals.
  3. Near-term BTC is in a choppy consolidation after a triangle breakout and rejection; the market needs a clean reclaim of the range high to resume upside.
  4. The broader risk backdrop matters: DXY strength, S&P 500 weakness, and upcoming U.S. macro prints could influence BTC.
  5. He presents the thesis as conditional on historical cycle structure, not guaranteed, and says the 4-year cycle can eventually break.
  6. He believes deeper downside would likely arrive only after key weekly and 2-week support layers fail together.
  7. The speaker is highly technical and highly confident, but his own framework depends on pattern continuity across multiple past cycles.

Market read by horizon

Short term

BTC looks tactically choppy after a failed push at range highs; unless it reclaims ~$94k, the near-term setup favors more two-way weakness or drift lower. Macro events and risk-asset pressure could matter immediately.

  • BTC has rejected after a breakout from a symmetrical triangle, so immediate upside looks capped unless the range high is reclaimed.
Show more
  • A move above the next resistance around $94,000 would open continuation higher.
  • A loss of the nearby range low would likely trigger another leg down.
Mid term

Over the next few weeks to months, the base case in this framework is continued consolidation before a larger downside phase, with confirmation coming if BTC loses the clustered weekly/2-week supports in the low-$80k area. If those levels hold and macro risk improves, the bearish cycle view weakens materially.

  • Base case is continued sideways consolidation before a later breakdown if the historical cycle pattern keeps playing out.
Show more
  • He says Bitcoin has already completed the first post-top mean-reversion leg and is now in the consolidation phase of the bear-market/cycle structure.
  • The next meaningful downside phase would likely start if BTC loses the 2-week 50 EMA, the weekly baseline, the weekly lower Gaussian band, and the 2-week upper Gaussian band cluster around the low-$80k area.
Long term

Structurally, the speaker believes Bitcoin is still governed by the 4-year cycle until it proves otherwise, with the eventual bottom likely forming in 2026 unless systemic conditions force a regime change. The lasting thesis is that BTC remains a cyclical risk asset whose major turns are tied to broader perceived systemic risk.

  • The speaker’s structural thesis is that Bitcoin still trades within a repeatable 4-year cycle until proven otherwise.
Show more
  • If his framework holds, the eventual macro bottom is part of a larger, slower-moving cycle that lasts well into 2026.
  • He believes the durable drivers of BTC price are perceived systemic risk factors such as rates, policy, geopolitical conflict, and taxation.
Unlock the full horizon read See the full short-term, mid-term, and long-term implications with confirmation and invalidation signals. Unlock horizon read

Key claims (4)

BEARISH crypto cycle timing Bitcoin

If the four-year Bitcoin cycle continues, the market bottom is likely around early October 2026.

The speaker assumes the cycle top was in October 2025 and subtracts the prior bull-market length from the 4-year cycle to estimate a bearish phase ending about one year later.

BEARISH crypto market structure Bitcoin

Bitcoin's bottom in that cycle would likely fall between $36,000 and $52,000.

The speaker ties that range to historical indicator behavior on the 2-week chart, especially the Gorsian channel, RSI, and 200 EMA proximity during prior bottoms.

BEARISH crypto market structure Bitcoin

A breakdown of several weekly and two-week support indicators would trigger the next major Bitcoin leg down.

The speaker says losing the 50 EMA, the Gorsian channel bands, and the weekly baseline would usher in capitulation and a larger move lower.

Unlock 1 more claim See the full bullish, bearish, and counter-consensus argument map extracted from the transcript. Unlock all claims

Assets discussed (6)

Bitcoin — BTC
MIXED crypto

Long-term bullish framing, but near- to mid-term he expects consolidation and potentially a later bear-market bottom.

DXY
BULLISH index

A firmer DXY is described as creating downward pressure on risk assets including BTC.

Unlock the full asset map (4 more) See all assets mentioned, their directional bias, and the exact reasoning. Unlock asset map

Where this transcript pushes against consensus

  • The 4-year cycle and 164-day bar theory are treated as highly predictive, but the evidence is based on a small number of historical cycles.
  • The exact October 2026 timing is very precise for a market framework that the speaker admits can break at some point.
  • The $36k–$52k bottom range is inferred from indicators rather than directly observed market evidence.
  • He states that the bottom is ‘not really my opinion’ while also making strong directional and timing claims.
  • The claim that a single support loss means all four key levels are effectively lost may be an oversimplification.
  • The video downplays the possibility that macro shifts could make the cycle invalid much earlier than the chart framework suggests.

Topics

Bitcoin cycle timingbear market phasesGaussian channelIchimoku cloudRSI bottomsshort-term BTC consolidationS&P 500 riskDXYmacro catalystscrypto risk management

Create your free research agent

Unlock the full claims, asset map, scores, related transcripts, follow-up questions, and AI chat — shaped around your portfolio, watchlist, favorite speakers, and risks.

  • Full claims and asset map
  • Personalized relevance to your watchlist
  • Follow-up questions you can track
  • Related transcripts from your workspace
  • AI chat about this video
Create your free research agent
TRANSCRIPTAGENT.AI