TranscriptAgent
Try it free
TRANSCRIPTAGENT.AI · transcript analysis

NASDAQ 25,000: The Ultimate Sell Signal Revealed As Dot-com Mirroring Escalates, Trade Setups

Channel: Verified Investing Published: 2026-04-27 08:31
Verified Investing

Gareth Soloway argues the NASDAQ is nearing a major resistance zone around 25,000, with chart parallels, M2-adjusted valuation, and dot-com-era comparisons all suggesting a possible top. He also warns that semis may be starting to crack, while he remains constructive on the very long-term outlook for precious metals despite expecting near-term downside first.

Watch on YouTube ›

Get the market thesis, key claims, assets, contradictions, and follow-up questions from any financial video — then unlock a version personalized to your portfolio, watchlist, and favorite speakers.

Detailed summary

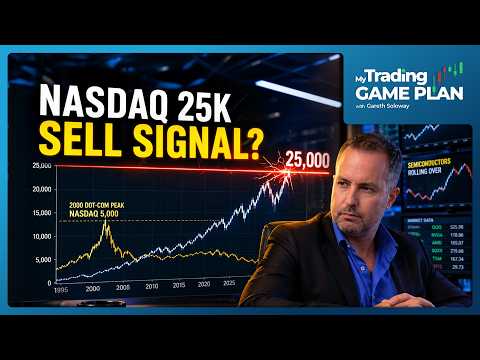
Gareth Soloway opens by framing the tape as mixed, with S&P futures fading into the open and oil modestly higher. He says markets are currently shrugging off geopolitical tensions, including instability around the Strait of Hormuz, because U.S. earnings and economic resilience are still supporting risk assets. His central focus is the NASDAQ, which he says is approaching a key upper parallel near 25,000. He emphasizes the similarity to the dot-com era, where the index pierced 5,000 before topping, and says the current chart is “spooky” because of the similarity 25 years later. He reinforces that bearish caution by dividing the NASDAQ by M2 money supply and arguing that the index has now pierced its dot-com-era high on that basis as well. He presents this as a warning sign, though he does not call a guaranteed top. …

🔒 The full detailed summary continues — read all of it free with an account. Read the full summary →

Main takeaways

  1. NASDAQ is approaching a major technical inflection near 25,000.
  2. He sees chart parallels and M2-adjusted valuation as warning signs of a potential top.
  3. Semiconductor leadership may be starting to weaken after an exceptional run.
  4. He thinks markets are currently prioritizing earnings over geopolitical risk.
  5. Gold and silver are short-term vulnerable in his view, but still strong over multi-year horizons.
  6. Natural gas is trying to base, and Bitcoin is near his downside target zone.
  7. He believes some AI/OpenAI-linked deal news is being overstated until real monetization appears.

Market read by horizon

Short term

The immediate setup is tactically crowded and fragile near a major NASDAQ resistance zone, with the semis needing to prove they can keep leading. A fast rejection at 25,000 or continued weakness in AI chips would make this a higher-risk chase.

  • NASDAQ is nearing the 25,000 area and could tag the upper parallel either today or this week.
Show more
  • He is watching for semis to roll over, especially ARM, Broadcom, Intel, and Marvell.
  • Nvidia is still above water, but he wants to see whether it can actually hold above the prior high.
Mid term

Over the next few weeks, the base case is either a breakout through 25,000 that confirms momentum is still intact, or a failure there that triggers a broader de-risking led by the semis. The key confirmation is whether earnings season and rate expectations can keep supporting price after leadership starts to wobble.

  • Over the next several weeks, his base case is that the NASDAQ may be close to a cyclical or sentiment-driven top unless follow-through strength appears beyond 25,000.
Show more
  • He expects any genuine market damage to show up first through leadership deterioration in the semis and then broader risk appetite.
  • He thinks gold and silver could continue lower for 3–6 months before forming a more durable bottom.
Long term

Structurally, he is arguing that the market may be revisiting dot-com-style excess, with liquidity and narrative inflation pushing valuation beyond durable fundamentals. If that regime view is right, the longer-term implication is a harsher re-rating once momentum breaks, even if the advance extends a bit further first.

  • He remains structurally bullish on precious metals over a 5–10 year horizon because of government spending, deficits, and money creation.
Show more
  • He views the current NASDAQ setup as potentially reminiscent of dot-com-era excess, with valuation and sentiment potentially stretched relative to money supply.
  • His broader regime view is that chart structure and liquidity conditions matter more than narratives when markets become extended.
Unlock the full horizon read See the full short-term, mid-term, and long-term implications with confirmation and invalidation signals. Unlock horizon read

Key claims (11)

NEUTRAL risk appetite

Markets are currently shrugging off geopolitical risk because U.S. earnings and the economy are still holding up.

He says the market ignores the Strait of Hormuz situation as long as earnings are good and the U.S. economy is hanging in there.

BEARISH technical resistance NASDAQ

The NASDAQ is approaching a major technical resistance near 25,000.

He repeatedly says the index is at an upper parallel and likely to touch 25,000 soon.

BEARISH bubble risk NASDAQ

The current NASDAQ setup resembles the dot-com era and could be signaling a major top.

He says the chart is eerie and compares the current 25,000 zone to the dot-com peak around 5,000.

Unlock 8 more claims See the full bullish, bearish, and counter-consensus argument map extracted from the transcript. Unlock all claims

Assets discussed (18)

NASDAQ
BEARISH index

Approaching a potential resistance/top zone near 25,000 within a parallel channel.

S&P 500
NEUTRAL index

Slightly negative futures and already near prior upper parallel.

Unlock the full asset map (16 more) See all assets mentioned, their directional bias, and the exact reasoning. Unlock asset map

Where this transcript pushes against consensus

  • The dot-com comparison is suggestive, but the transcript does not establish that current fundamentals, leverage, or market composition are comparable enough to justify the analogy as a predictive framework.
  • He treats the NASDAQ/M2 ratio piercing the dot-com high as an alarm bell, but does not show why that specific ratio should have stable historical meaning across very different monetary regimes.
  • The claim that markets are ignoring the Strait of Hormuz because of earnings is plausible, but it is asserted more than demonstrated.
  • The suggestion that inflation calculation changes would mainly be a way to make inflation look better is speculative and not supported with specifics in the transcript.
  • The bearish read on gold and silver over the next 3–6 months conflicts somewhat with his strongly bullish long-term framing, though he does separate the horizons.

Topics

NASDAQ resistancedot-com comparisonM2 money supplysemiconductor stocksOpenAI dealsFed and inflation methodologygold and silvernatural gasBitcointechnical analysis

Create your free research agent

Unlock the full claims, asset map, scores, related transcripts, follow-up questions, and AI chat — shaped around your portfolio, watchlist, favorite speakers, and risks.

  • Full claims and asset map
  • Personalized relevance to your watchlist
  • Follow-up questions you can track
  • Related transcripts from your workspace
  • AI chat about this video
Create your free research agent
TRANSCRIPTAGENT.AI